Have you ever wanted to display event records in a calendar format? Of course you have! And FileMaker Pro 11 makes this so much easier with filtered portals.
Portal filters present something of a dilemma to the experienced FileMaker developer: why should I use them? Can’t I get the same effects with complex relationships? As I mentioned in a previous post, filtered portals certainly have their limitations, particularly when it comes to calculations using related data. But when I first started experimenting with filtered portals, what struck me about their potential was this: they are extremely flexible when it comes to presenting information.
Developers have been creating calendar interfaces with FileMaker for a while using a technique involving forty-two separate relationships and portals. The reason for so many relationships is entirely for presentation: displaying each event on the right day of the month requires one relationship per displayed day. That’s where FileMaker Pro 11’s filtered portals come in. Filtered portals allow us to create a much cleaner relationship graph that’s easy to maintain and modify, and which is much easier to use in scripts, conditional formatting, and so on. There are still good reasons to sometimes define complex relationships in the graph, but filtered portals can simplify this:
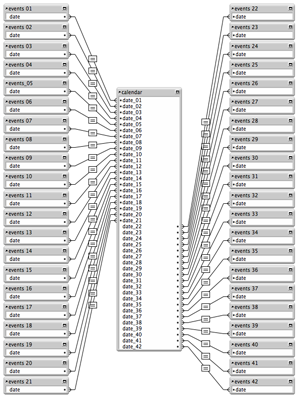
to this:

Let’s see how it works.
How many weeks are in that month?
Before we start creating any fields, relationship, or portals, let’s think about how to lay out a calendar. For any given month, we want to show all the days , somewhere between twenty-nine and thirty-one. These days should be arranged in a grid, with seven cells going across in a row to create a week.
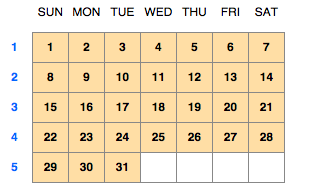
Let’s say we’re focusing on August 2010 (as we plan our trip to DevCon in San Diego). August 1st is a Sunday, falling in the first cell in the first row of our grid of days. The 2nd is obviously Monday, and so on. After seven days, we start a new week (and row), and after twenty-eight days we have four rows. The last several days will fill the first three cells of a fifth week.
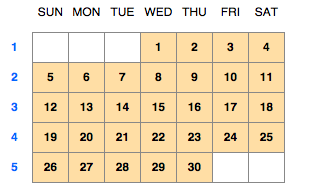
The following month, September, starts on a Wednesday. In the first row, we leave Sunday through Tuesday (cells one through three) empty. Our first week of September is a partial week, as is the fifth week ending on Thursday.
As we can see, a month will generally pass through at least five weeks (unless it’s a February starting on a Sunday, and not a leap year). A month will actually pass through six weeks if it starts on a Saturday, or has thirty-one days and starts on a Friday (again February, of course, is the exception). October, 2010 starts on a Friday and ends on the Sunday of week six.
As we position our event information, we’ll need to account for these six possible weeks. If you prefer your week to start on Monday as opposed to Sunday, you can refer to our updated post.
While there are 42 days in six weeks, we technically only need to worry about the first 37 of them; at most, a month will end on the Monday of the sixth week. We usually tackle all 42 days, as that allows us to decide whether or not to show event information in the “extra” days that make up the partial weeks at the beginning or end of the month.
Setting the position of the days
To specify a month, we start by choosing a date (in the field datePicked): we’ll go with October 9, 2010. To see a calendar for October, we’ll need to figure out the first and last days of that month. The first of the month is easy: starting with datePicked, we take the same month and year, and set the day to the first:
Date ( Month ( datePicked ) ; 1 ; Year ( datePicked ) )
Determining the last of the month isn't too difficult. We could jump through all kinds of hoops to test to see if our given month has thirty or thirty-one days, or if it’s February, and if so, if it’s a leap year. Or we can take the much easier route of finding the first day of the next month, and then subtracting one from the day to go backwards:
Date ( Month ( datePicked ) + 1 ; 1 ; Year ( datePicked ) ) - 1
We have the dates 10/1/2010 and 10/31/2010. Let’s now figure out how those days will fall into our grid of forty-two cells. The first of the month can fall on any day of the first week; to determine the Sunday of that first week, we can use the following formula (the details of which I discussed in a previous post):
Div ( firstOfMonth ; 7 ) * 7
October 1st is a Friday; the Sunday that started the week was September 26th.
Starting from September 26th, we need to fill the next forty-two days into our grid. Let’s use a new feature of FileMaker Pro 11 and use variables, now that we can display them as merge text on a layout. We will need forty-two separate variables: $$day01 = 9/26/2010, $$day02 = 9/27/2010, and so on through $$day42 = 11/6/2010. Our October dates will appear in $$day06 through $$day36.
Except… we really don’t want or need the September and November dates. We could just ignore those dates and corresponding variables and start with $$day06. The problem, though, is that if we use a variable as merge text, and that variable has not been set, you don’t see a blank value—instead, you see the full variable name, with surrounding angled brackets, appearing on your layout. If we’re going to use merge variables, then we’ll need to set them to some value—in this case, a single space.
It would be very cumbersome to write a script that sets forty-two separate variables. Instead, I’m going to use a technique from a previous post to set the variable names dynamically, using the Let and Evaluate functions, and use a loop to go from 1 to 42:
Set Variable [$start; Value:GetAsDate( Div(calendar::firstOfMonth ; 7 ) * 7 )]

Set Variable [$thisMonth; Value:Month ( calendar::firstOfMonth )]

Set Variable [$n; Value:0]

Loop

   Set Variable [$n; Value:$n + 1]

   Exit Loop If [$n > 42]

   Set Variable [$d; Value:$start + $n - 1]

   Set Variable [$varName; Value:”$$day” & Right( “0” & $n ; 2)]

   Set Variable [$varValue; Value: If ( Month ( $d ) = $thisMonth ; $d ; “ “ )]

   Set Variable [$varType; Value: If ( Month ( $d ) = $thisMonth ; “Date” ; “Text“ )]

   Set Variable [$garbage; Value:  //see below ]

End Loop

Refresh Window
/* universal formula for dynamic variable naming, assuming the existence of $varName, $varType, and $varValue */
Let (
[
varName = If ( Left ( $varName ; 1) ≠ "$" ; "$" ) & $varName ;
varType = GetValue ( FilterValues ( "Text¶Number¶Date¶Time¶Timestamp" ; $varType ) ; 1 ) ;
varValue = $varValue ;
f = "Let ( ~varName~ = ~varValue~ ; \"\" )" ;
fGetAs = "Let ( ~varName~ = GetAsXX ( ~varValue~ ) ; \"\" )" ;
formula = If ( IsEmpty ( $varType ) ; f ; Substitute ( fGetAs ; "XX" ; $varType ) )
] ;
EvaluationError ( Evaluate (
Substitute (
formula ;
[ "~varName~" ; varName ] ;
[ "~varValue~" ; Quote(varValue) ]
) // close Substitute
) ) // close Evaluate
) //close Let
Whew. Maybe the brute force method of declaring forty-two variables would have been easier? Actually, the script itself is fairly short; it’s the calculation that’s a bit complex, but we copy and paste it between files all the time. This way, if we need to make changes to our script, it’s a lot more manageable.
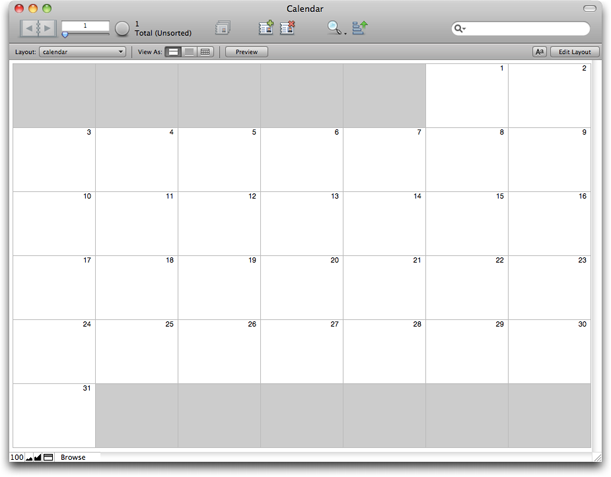
Now that we have our variables, we can place them as merge text on our layout, arranged in six rows.
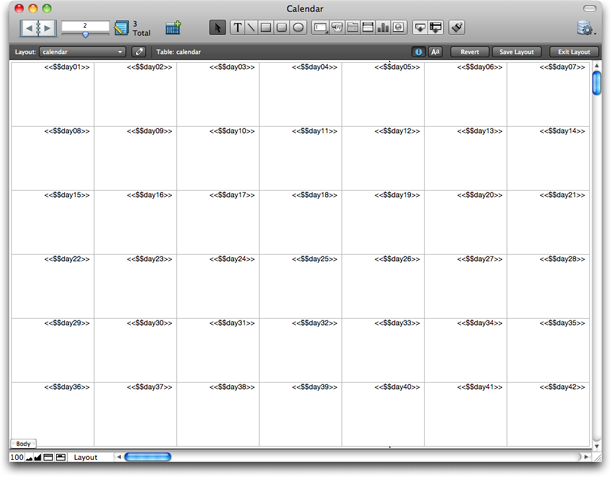
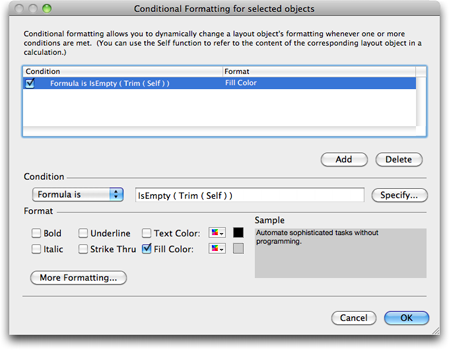
Let’s apply a little conditional formatting to indicate that the empty cells aren’t part of this month.
Placing the events in the proper day
As I mentioned at the beginning of this post, the most traditional method of forcing events information to show up on the right day of our 42-cell grid is to create a separate relationship for each:
- Define 42 calculation fields in the calendar table
- Create 42 occurrences of the events table
- Create 42 relationships, from the calendar table to each of the events tables
- Arrange 42 portals, one for each occurrence of events, in a grid on your layout
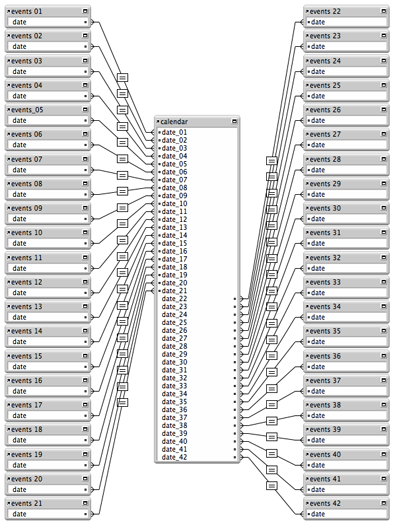
It certainly works (I’ve done it many times myself), but any changes can become a major undertaking. For example, let’s say your want to apply some conditional formatting to the fields in the portal, to highlight birthdays. In the portal for the first cell in the grid, you create condition of:
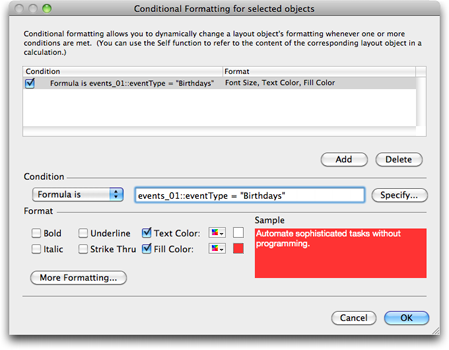
Because each field in each portal is being drawn from a separate table occurrence, you would need to apply separate conditional formatting for each (in the second portal, the formula would be events_02::eventType = “Birthday”, and so on).
Using FileMaker Pro 11 and portal filters, all we do is:
- Define one relationship from the calendar table to the events table
- Create one portal to show all events for the month
- Duplicate the portal 42 times, and arrange one in each cell of our monthly grid
- Create a filter for each portal to show only the events for that day
At first, this may look like the same amount of work—I mean, we still have forty-two portals to deal with, right?
We have the same amount of portal, but there’s actually a lot less work involved. For one thing, we only had to create one relationship in our graph. The relationship from calendar to events returns all the events for our selected month, when the event date is between the first and end of the month:

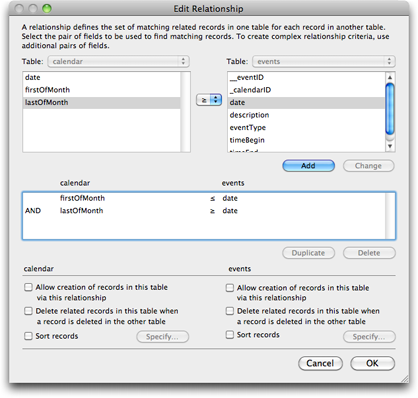
Now we create a portal using this relationship, duplicate forty-two times, and align with our grid.
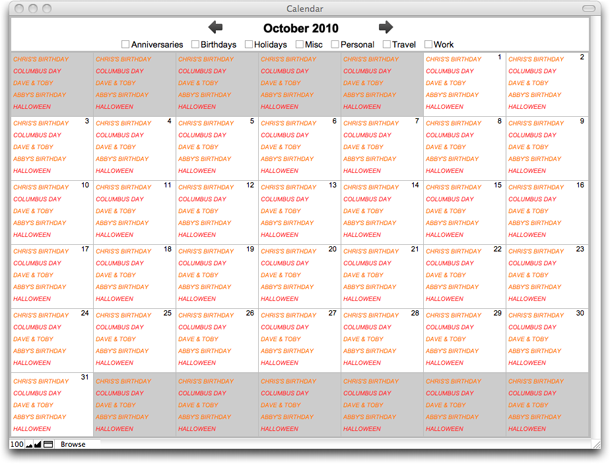
Now we apply our filters. In the first portal, we use the formula events::date = $$day01 to show only the events that would fall in the first cell/day:
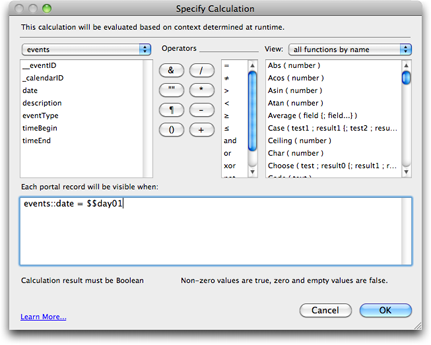
Repeat forty-two times, changing the filter formula. In the second portal it’s events::date = $$day02,events::date = $$day03 in the third, and so on. Since October 1, 2010 starts on a Friday, our calendar will start with events from that date appearing in the sixth portal, when events::date = $$day06.
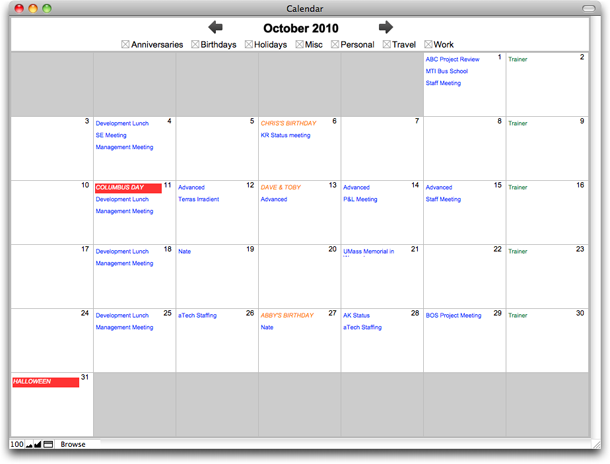
The most tedious part of this procedure is duplicating the portal and making the changes to the formula, but it’s still faster than creating forty-two separate portals to different table occurrences. The real payoff, though, comes when it’s time to make the inevitable changes.
Let’s apply the same conditional formatting to highlight birthdays. Since each portal is using the same table occurrence, we can use the exact same filter formula on every field in the portals. Select all the fields at once with your preferred technique for selecting multiple objects, and apply the conditional formatting rule:
events::eventType = “Birthday”
Similarly, let’s say that we now decide that we want to further modify the calendar so that events belong to calendars (“Work”, “Personal”, etc…), and we want to give users the ability to show and hide calendars. We need to make only one small change to our graph, rather than editing forty-two relationships:
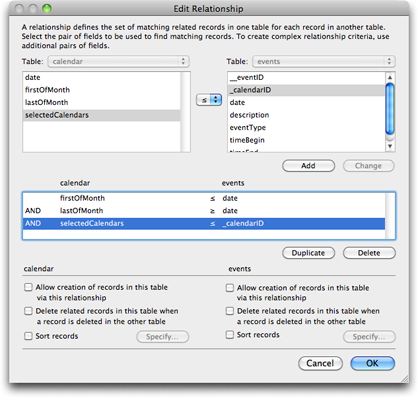
I don’t know if I can say this enough: because we’re using portal filters instead of separate table occurrences to place events in the proper days of our calendar, we can use the same scripts, relationships, conditional formatting, tool tips, etc… without worrying about setting parameters, using GetFieldName and Evaluate calculations, or other indirection tricks. Life is so much simpler with portal filters.
Final thoughts
There’s more to be done, of course. We need to spruce it up, sizing and aligning everything, fading or hiding the lines of the portals so they blend better with the merge variables behind them. We also probably need to give the user a way of setting that datePicked field; a field formatted as a drop-down calendar may be all we need, but we could come up with some snazzier interfaces.
There are some decisions we’ve made that could have gone another way. For example, we’re only showing events in the actual month in question, but we could have decided to also show events in the days that appear in the “partial weeks” before and after the first and end of the month. Fortunately, we could make this change very simply by editing our single relationship (pushing the start and end dates outwards) and the script to set the merge variables (filling in the date regardless of the proper month), all without any changes to our forty-two portals.
The ability to filter portals doesn’t mean there’s no longer a need for complex, multi-predicate relationships with comparative operators. We’re using one here, in fact, to find the month’s events, before using portal filters to place those events in the appropriate days. But when you find yourself creating a really complicated relationship graph—one of those graphs that requires extensive documentation just to make sense of it—consider moving some of that logic out of the relationships at the schema level to the portals at the layout level. Using portal filters in combination with complex relationships can make your systems more flexible, extensible, and easier to maintain.
| Download Sample File |

